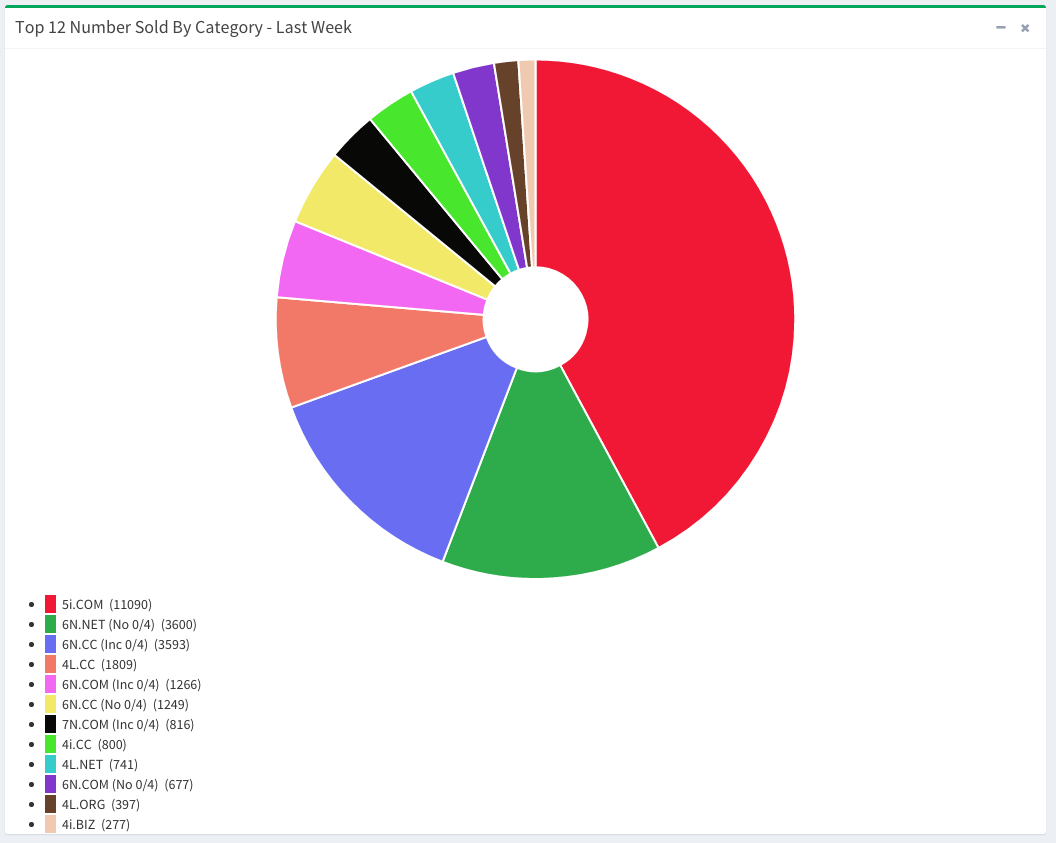
I guess someone really wanted 12058.com. It is listed as sold for $2133 which spiked the daily percentage change vs. the 30 day moving average. It is also listed as the only 5N.com sale with a 0/4. I’ve also included the weekly volume pie chart below the daily chart.
| Numeric | .com | Δ30MA .com |
.net | Δ30MA .net |
.org | Δ30MA .org |
.cc | Δ30MA .cc |
|---|---|---|---|---|---|---|---|---|
| 3N | $366,836 (0) |
↓-12.9% | $5,972 (0) |
↓-20.44% | $2,440 (0) |
↓-0.24% | $5,835 (0) |
↓-16.56% |
| 4N | $14,588 (0) |
↑ 0.2% | $642 (0) |
↓-15.34% | $95 (0) |
↓-7.01% | $365 (1) |
↓-16.42% |
| 5N | $2,133 (1) |
↑ 98.65% | $47 (7) |
↑ 6.51% | $7 (21) |
↓-17.8% | $23 (0) |
↓-42.08% |
| 6N | $20 (392) |
↓-32.09% | $7 (13) |
↓-20.8% | $4 (0) |
↓-14.48% | $2 (144) |
↓-17.33% |
| 7N | $12 (120) |
↓-22.5% | $0 (0) |
0% | $0 (0) |
0% | $0 (0) |
0% |
| 8N | $0 (0) |
↓-100% | $0 (0) |
0% | $0 (0) |
0% | $0 (0) |
0% |
| Numeric No 4 or 0 |
.com | Δ30MA .com |
.net | Δ30MA .net |
.org | Δ30MA .org |
.cc | Δ30MA .cc |
| 3N | $366,836 (0) |
↓-34.22% | $20,867 (0) |
↓-13.9% | $3,668 (0) |
↑ 17.77% | $21,328 (0) |
↑ 2.08% |
| 4N | $36,683 (0) |
↓-6.12% | $1,621 (0) |
↓-10.15% | $336 (3) |
↓-2.85% | $1,672 (1) |
↓-20.84% |
| 5N | $3,519 (4) |
↓-2.09% | $206 (2) |
↓-10.34% | $32 (0) |
↓-37.84% | $230 (1) |
↓-23.24% |
| 6N | $212 (32) |
↓-24.91% | $16 (112) |
↓-18.95% | $5 (0) |
↓-27.57% | $17 (197) |
↓-21.23% |
| Initials, Letters & Characters |
.com | Δ30MA .com |
.net | Δ30MA .net |
.org | Δ30MA .org |
.cc | Δ30MA .cc |
| 3I | $64,324 (0) |
↓-4.22% | $3,762 (0) |
↑ 0.87% | $1,472 (0) |
↑ 3.5% | $2,085 (0) |
↓-14.27% |
| 3L | $23,034 (0) |
↓-35.46% | $1,181 (0) |
↓-10.17% | $614 (0) |
↓-39.59% | $331 (0) |
↓-12.21% |
| 3C | $459 (0) |
↓-41.25% | $18 (0) |
↓-58.88% | $7 (0) |
↓-26.44% | $8 (30) |
↓-61.67% |
| 4I | $1,929 (22) |
↓-14.22% | $222 (19) |
↓-13.82% | $28 (3) |
↓-11.52% | $86 (102) |
↓-15.45% |
| 4L | $344 (7) |
↓-21.03% | $23 (239) |
↓-12.3% | $6 (0) |
↓-28.46% | $9 (599) |
↓-16.47% |
| 5I | $17 (770) |
↑ 2.73% | $0 (0) |
0% | $0 (0) |
0% | $0 (0) |
0% |
N = Numeric
I = Initial (a letter not including a,e,i,o,u,v)
C = Character (any number or letter)
Δ30MA = Change vs. 30 day moving average
The number in parentheses below the price is the volume sold
Source: Chaomi.cc
I haven’t really been following the Chinese markets much. When they first hit, they hit hard and and the wave just got bigger. I thought to myself that this has got to be a trend with an expiration date. Not really sure how long that wave would last, I assumed it would be a short 1 to 2 year soaker.
So far, it looks like my predictions might be right with the slow decline in some sectors, however I see that other sectors are still gaining. Maybe an after shock of the smaller investors trying to piggy back the bigger investors later in the game.
I’m not sure how this trend will end, how many will win and how many will lose, but I do think that the numbers are starting to show the slip already. I think the only question remains is how low or fast will that slip turn into a domino effect.
Is it time to dump portfolios and get out while you can still make a profit? Not sure, but I think taking your eyes of the ball (Numbers) would be a big mistake.
Thanks for sharing the numbers, it’s helps keep things in more perspective.
Thanks Eric,
Like many of us have said, we have been taking profits as we go and many of us are operating on “house” money. It really comes down to whether you were part of the initial market or you chased. Chasing investments of any kind always has issues. I expect more of these types of comments to come out now that things have declined for a week. Everyone will continue to be wrong until they are right 🙂 And to make it clear, I completely see how people are skeptical of this market. I experienced the exact same thing with the opening of the Chicago Board Options Exchange. “You mean I don’t even get to own the stock?”
Well, it would have to decline quite a bit, since I bought TONS on NNNNN off of Shane’s list a few years ago for 50-70 bucks each. Plus when I bought these the CDN-USD was at PAR, now when I sell and convert, I am up an extra 30-35%! Shane has made alot of us RICH! -Mike Maillet