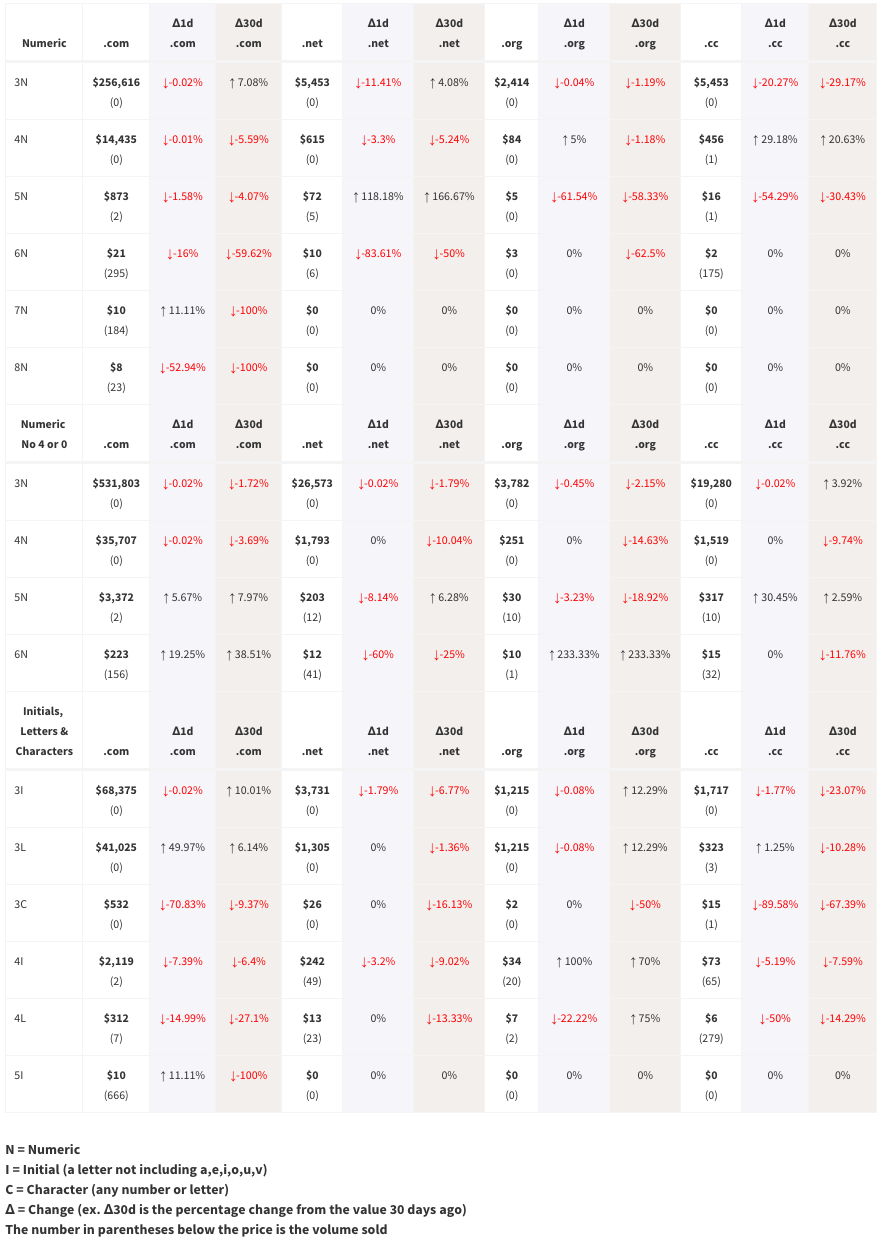
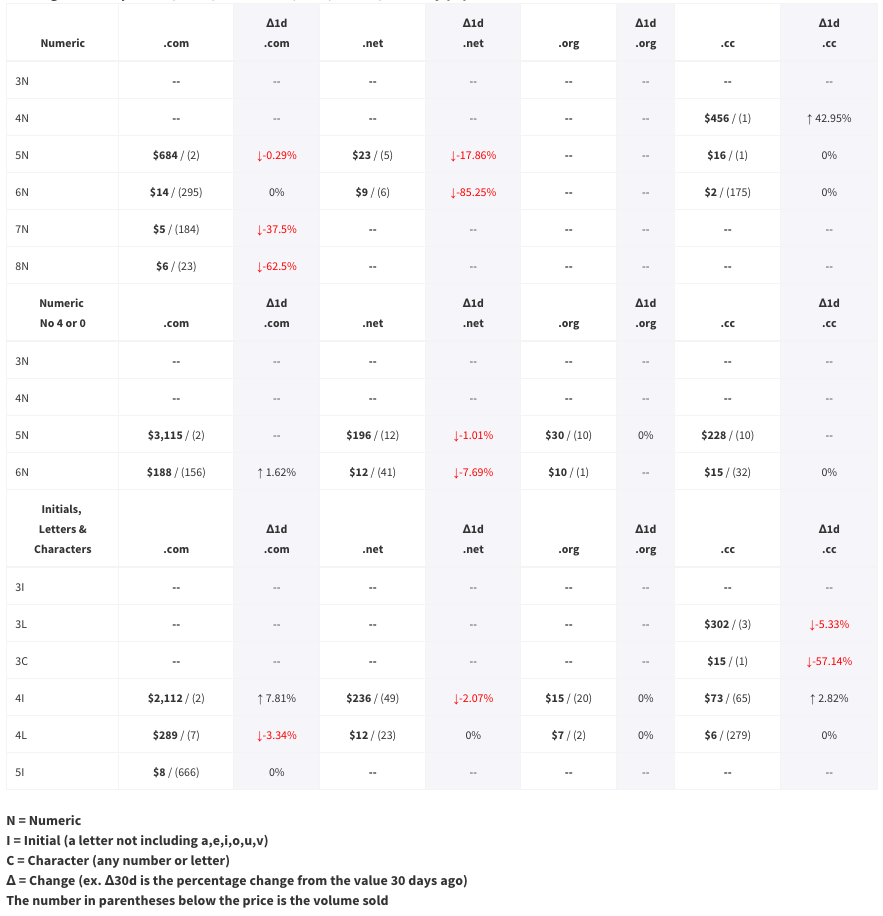
As requested, I’ve put together another summary report showing lowest price of the day (including volume) rather than average price for the day. I can see how this will be a useful alternative for investors wanting to know floor prices. I’ve kept the format mostly the same. I wanted to flatten the chart so instead of putting the volume below the price, I’ve added a slash and kept it on the same line. I also do not bother with zero volume categories for this report. If the volume for the day is zero, then I’ll blank out the category for the day. Similarly, if the volume was zero yesterday but not today, I’ll blank out the percentage change section for the day. I’m keeping both charts in the daily report for now. The first will be average and the second will be low price. Let me know which is more useful to you, and if most people agree on one, then I can just drop the other one.
Note: I’m currently getting this data from Chaomi, and I’m only looking once a day. So for categories that have more than 50 or so sales per day, this is only going to show you the lowest sale price of the most recent 50 sold. That means that this may not actually be the lowest sale price of the day. If the daily volume is less than 50, then the lowest sale price of the day should be shown.
Dude. Your charts are crazy small. Cant view them on mobile, and pc i can barely see them. Can you use imgur.com.to host?
On a pc, you need to click on them, and they will open in a much larger view. The same is true on mobile, but you have to click on the image, then click on the 4 arrow square and then click the same square again to get it to expand to the full size.
Travis,
You are much nicer than me. Dude doesn’t like the double click 🙂